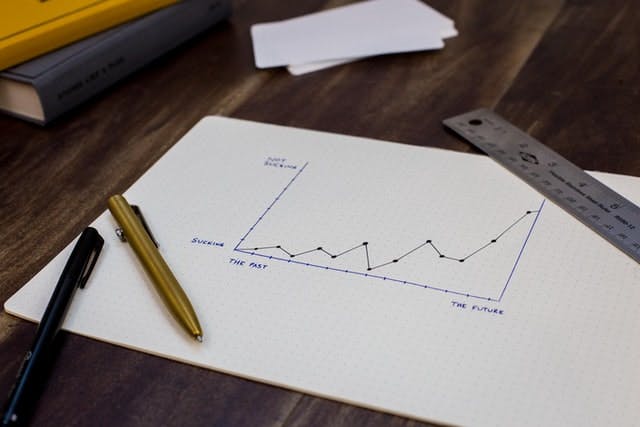
Greeting you as X-axis Y-axis, 👋
There are many things to consider when choosing the right data visualization or charts tool for our web page. We will be going through the best data visualization tools for our needs.

Now the question is,
Question - "What Are Data Visualization Tools?" 🛠 🧰
Ans - Data visualization tools provide data visualization designers with an easier way to create visual representations of large data sets.
The answer is not perfectly clear and understanding unless we see what it means.
We all know it's pointing to the direction of a chart or graph which may be d3.js or chart.js similar kinda lib. Yes, you’re absolutely correct here but I want to point out the important part of it.
Do you know when someone buys a theme for the admin panel what should be most Circean in terms of UI? 60% Ans would be Charts and Graphs.
Let's roll over the Visualization lib or tool... 👇🏻
AntV - Liven Data Lively
A new generation of data visualization solutions from Ant Group.
Don't worry about the "Liven Data Lively" it's the slogan.
Here is what AntV provide the full list of the things which treasure for us.
- G2 -Data-driven visual language with a high level of usability and scalability.

- F2 - F2 is born for mobile, developed for developers as well as designers. It is Html5 Canvas-based and is also compatible with Node.js, F2 provides all the chart types you'll need. Our mobile design guidelines enable a better user experience in mobile visualization projects.

- G6 - is a graph visualization engine with simplicity and convenience. Based on the ability to customize, it provides a set of elegant graph visualization solutions and helps developers to build up applications for graph visualization, graph analysis, and graph editor.

- X6 Diagram Editing Engine - X6 is AntV's diagram editing engine, which provides a series of easy-to-use interactive components and node customization capabilities to facilitate the rapid construction of DAG diagrams, ER diagrams, flowcharts, and other applications.

- L7 Geospatial Visualization - Large-scale WebGL-powered Geospatial data visualization analysis framework

- AVA - AVA is a framework for more convenient Visual Analytics. The first A of AVA has many meanings. It states that the goal of this framework is to become an Automated, AI-driven solution that supports Augmented analytics.

All the above have there owned capabilities and concepts but if you're looking for specific in React version of it, then I will recommend you to go for Ant Charts
Let's see in action -
- Ant Design Chart - Simple and easy to use React chart library

installation
$ npm install @ant-design/charts
import React from 'react';
import { Line } from '@ant-design/charts';

const Page: React.FC = () => {
  const data = [
    { year: '1991', value1: 3 },
    { year: '1992', value: 4 },
    { year: '1993', value: 3.5 },
    { year: '1994', value: 5 },
    { year: '1995', value: 4.9 },
    { year: '1996', value: 6 },
    { year: '1997', value: 7 },
    { year: '1998', value: 9 },
    { year: '1999', value: 13 },
  ];

  const config = {
    data,
    height: 400,
    xField: 'year',
    yField: 'value',
    point: {
      size: 5,
      shape: 'diamond',
    },
    label: {
      style: {
        fill: '#aaa',
      },
    },
  };
  return <Line {...config} />;
};
export default Page;
And here is the final output is 👇🏻
Wrapping Up
Hope you enjoyed this article. Go add some nice reactions and cool comments below. You only need a few moments to like and comments, it will encourage me to write more good articles in the future. Share it with your friends let them know about this article.
Thank you for your time.✌️
Finally ✍️
If you have time then do check out my other article & many of them are related to Ant. Design.
Here is the most viewed post so far 👇🏻
👋 If you're using Twitter and posting code snippets then do checkout bonus post for you.
I'm also available on Twitter & do follow for Tips and Tricks and developer journey with me.
Thank you for your valuable time. ⏰ Your applications will make my day🙏
